|
Software-On-Board Online Manual |
|||||||||
|
|||||||||
|
SOB v MAX Introduction
See also C-Map's dedicated website for MAX-Specific features: www.maxnavigator.com SOBvMAX Install Information SOBvMAX will install into a new folder, and not share files currently in SOBv90. Use Explorer to copy your Routes, Waypoints, Logs etc over to the corresponding folders in SOBvMAX. You can also copy over any demo NT+ chart areas that are not included with MAX. Using Older charts with MAX Charts SOBvMAX includes new MAX format background and demo chart areas. However SOBvMAX will still display the NT/NT+ C-Map charts. If charts of both types covering the same area are present, then SOB will only show the MAX version, ignoring the other. However the POI Find function (Binocular button) may return duplicates if overlapping regions are present.
Perspective View toggled with [F12]. The Conversions form is now the last page on the Ship's Form [F9]. More chart display filter options.
Physical Size of Display Monitor. In order for the chart's text labels to be displayed in the best size, you need to physically measure (in cm) the width of your monitor and enter it at the bottom of the CustomSettings Page on the Ship'sForm [F9]. SOB will need to be restarted for any change to take effect. Buoy Names displayed. This option is selectable from the Custom's page and works with MAX and older charts. The size and readability of the text labels used is highly dependent on your monitor width setting (see above). Ship's Label. If visible, will automatically hide if you move the mouse over it. It will be redisplayed with the next chart refresh. Set and Drift information has been added to this label (see below for details). UTC in PastTrack File. This was mistakenly adding two hours to the point's UTC time when saved. This has been corrected. Quick Navigation Info Box. Was incorrectly displaying the GreatCircle distances. This is now corrected. When the difference between GreatCircle and Rhumbline distances is less than 5 nm, then a generic "Distance" is displayed representing the Rhumbline value.
Land and Sea Shading. The MAX charts include far more detail about depths and land heights and shows this with extra degrees of colour shading. For most purposes this enhances the chart display. However SOB's drawing tools are best shown on a white background, and certain colours can be reversed or disappear completely if drawn on a coloured background. When navigating, and particularly when using the AIS/ARPA Targets, you should disable the Shading using the button on the [F3] toolbar.
Zooming. [F3] Toolbar: these settings
typically work the best: The zooming algorithm has been changed (again) it is now more like it worked in SOBv6X. Ver 90 zoomed along a pre-set range of scale values, choosing the best chart level for the chosen scale. In SOBvMAX, each zoom request first tries to over (or under) zoom the current level by a pre-set factor. If the over/under zoom creates a chart of poor scale, then the next available level is chosen. [F2] Toolbar and [Alt-Space]: A consequence of the new zooming mechanism is that a particular level can be directly selected (if available, otherwise the nearest available level is chosen).
|
|||||||||
|
Perspective View ... [F12] or [3] or tickbox on Ship'sForm>>CustomPage gives a selectable elevated view rather than the typical overhead view. Over/Under zooming is not permitted in perspective view. Only available chart levels shown at their digitised scales will be allowed, so MixLevels and OverZoom are disabled in this view. Consequently a lot more "grey area" will appear in Perspective View. All usual chart functions and navigation tools are available, although some may be found to be unsuitable with some configurations.
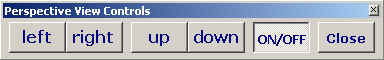
The viewing position can be moved to give a different "shape" to your chart. You may want to hide the display of certain objects, or choose de-clutter mode to speed the chart drawing time (on slower machines) and/or to make the view more "readable". In Perspective View a new toolbar appears with Up/Down Left/Right On/Off controls. The Up/Down and Left/Right can be changed to move in small or large steps with the [Shift] key - used as a toggle (you don't have to hold it down).
[F3] toolbar or Ship'sForm>>CustomPage Turns on a real-time blinking of lights on the chart. All characteristics of the light are correctly represented:
Notes: the normal sectored light display (the coloured circular ring) is disabled when light animation is on. The animate feature is especially impressive when you darken the chart colours using the [F7] key for night display.
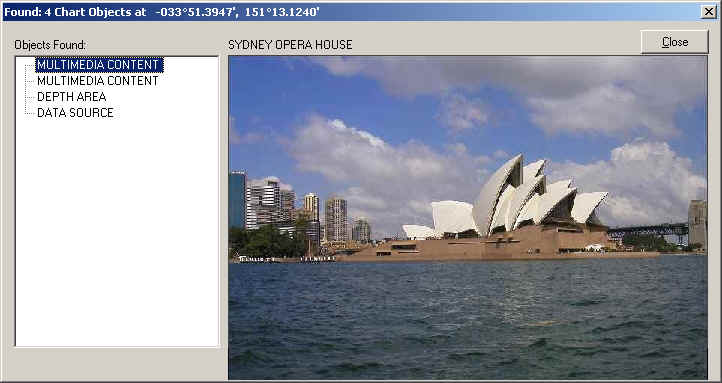
The Camera Icons show points on the chart containing photographs of the area. (Note: the next MAX version will contain information about the direction and elevation of the camera when the shot was taken). Show/hide these icons on the Custom Page. Right click a camera icon will show the photograph on the Objects Found form.
Many more tide stations, and new current stations are included on MAX charts. These are shown as colour-coded and proportionately-sized arrows. Hover the Info cursor over these arrows will give speed/direction of current flow. The value is for the current time - UTC from a connected GPS is used, or if no GPS then the PC's time is used. The next SOB update will have a facility for changing the time of the prediction. Meanwhile you could disconnect your GPS and change your computer's time to get a future prediction!
Other New Features or Enhancements
Ship's Label will hide itself if the mouse is moved over it, to help reduce clutter around the Ship's posiiton. The label will re-appear with the next chart refresh. Set and Drift and/or Leeway
Display and Calculations. The S&D vector (if drawn) would be from the small arrow to the large one. In other words, your SOG & COG from the GPS (large arrow) is the resultant of your boat speed and heading (small arrow) and the current movement (or leeway on a sailing yacht). Mathematically, this is: R = V + L Where R,V & L are the vectors: R = SOG/COG, V = SPD/HDG, L = S&D
Targets Additions. [T] or AIS/ARPA
button
Target MMSI, CallSign and Name are selectively displayed on screen.
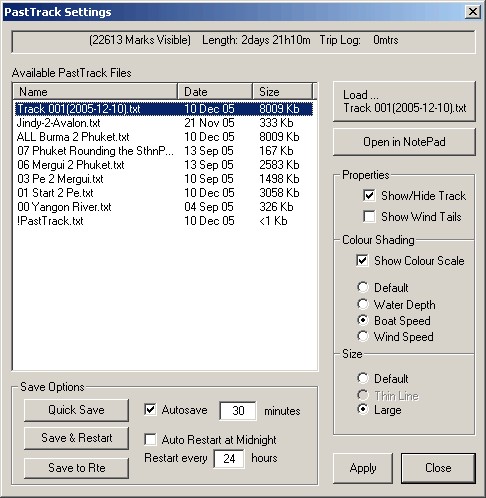
PastTrack. Query any past position with the Info cursor [Enter] key or "Info" button.
PastTrack Management Manage the display of the current pasttrack
with this pictured form:
Anti-Grounding. Is still being adapted for the MAX chart objects and is currently disabled.
|
|||||||||


| Manual Index | DigiBOAT Home |